Deterministic ingestion
Process two versioned CSV sources through a repeatable pipeline before each production build.
A dashboard-first demonstration of how structured source files can be validated, modeled, and delivered as an interactive executive reporting layer.
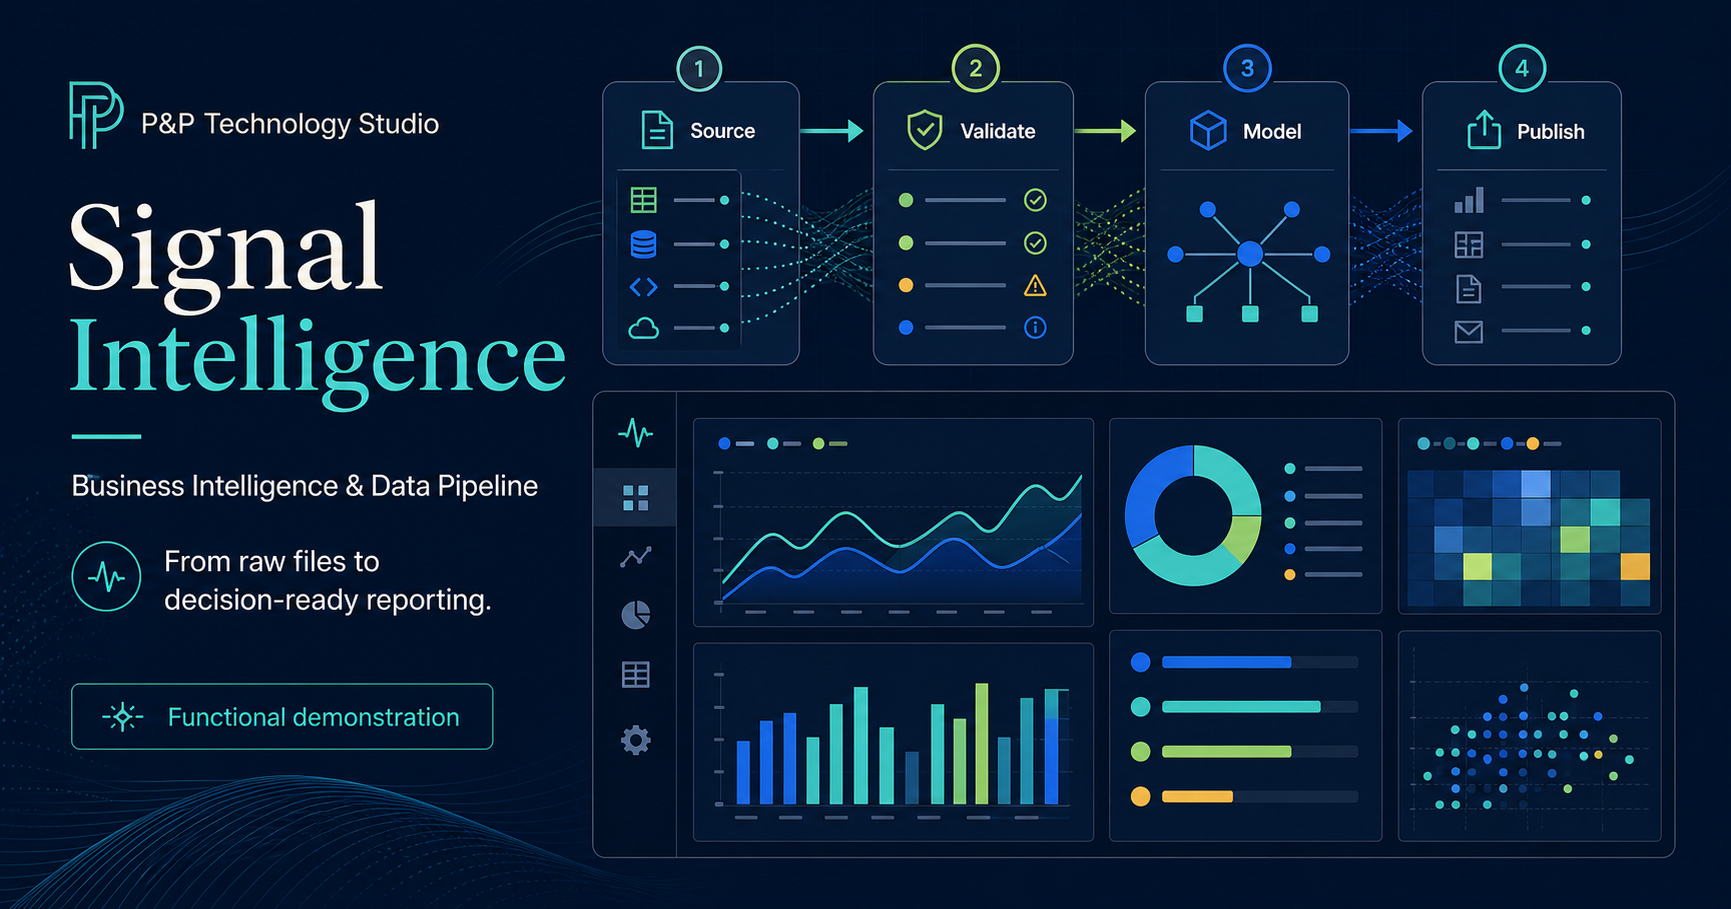
The demonstration focuses on reproducible data processing and analytical interaction. It is not client work and does not claim production usage, customer outcomes, or P&P Technology Studio performance.
Process two versioned CSV sources through a repeatable pipeline before each production build.
Validate required fields, identifiers, dimensions, dates, and numeric ranges before modeling.
Explore revenue, margin, delivery, region, channel, segment, and target measures in one workspace.
Filter the modeled reporting layer by period and region across coordinated dashboard views.
Trace the flow from source files through validation and modeling to the published analytics dataset.
Run the pipeline, automated tests, and production build from documented source code.
The source files, validation pipeline, generated analytics model, filters, dashboard views, tests, source code, and cloud deployment are functional.
Every transaction, target, metric, region, status, and performance value is fictional sample data created only to demonstrate the product experience.